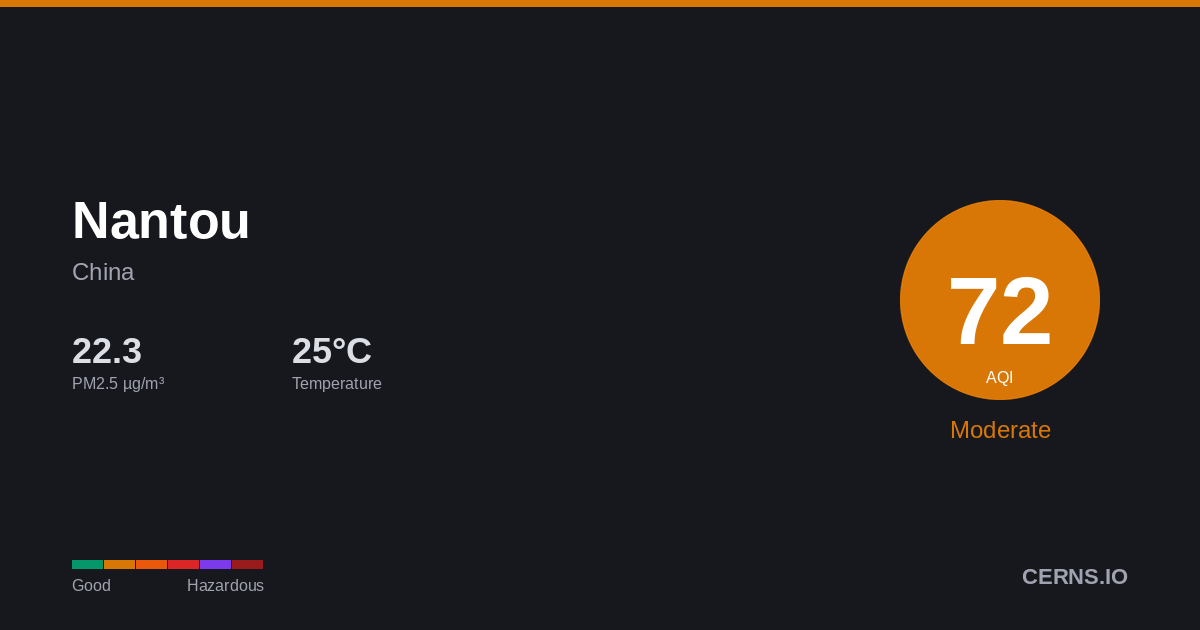
Air Quality in Nantou, China
Cloudy
26.5°C · 71.6% humidity
26.5°
Feels 26.5°
70
Moderate
Unusually sensitive people should consider reducing prolonged outdoor exertion.
11 stations
Nearby Monitoring Stations
Nantou's air quality — share it
AQI Forecast
66
3pm
66
66
70
6pm
137
139
141
9pm
143
144
144
12am
145
145
145
3am
146
146
84
6am
83
66
66
9am
54
54
54
12pm
66
66
Air Quality Index Trend
46h · 67 stnNantou's air quality is influenced by industrial emissions, vehicle traffic, and regional pollution transport. Winter heating season and spring dust events typically create the most challenging air quality conditions. Current PM2.5 concentration in Nantou is 1.4× the WHO 24-hour guideline of 15 µg/m³.
71.6%
Humidity
29.8 km/h
Wind E
1006.4 hPa
Pressure
0.7
UV Low
GoodModerateUSGUnhealthyVery UnhealthyHazardous
Which pollutant is driving the AQI?
PM2.5▲
21.32 µg/m³
PM10
79.9 µg/m³
050100150200300500
What is the weather forecast for Nantou?
Temperature & Precipitation
PM2.5 Trend
46h · 67 stationsPM2.521.32 µg/m³
×1.4 WHO
Moderate
PM1079.9 µg/m³
Moderate
UV INDEX0.7
Low
Station readings (11 stations within 25 km)
21.32
Median
24.33
Average
19.7
Low
31.6
High
PM2.5 µg/m³ · Model: 27.55 · Bias: +6.2
What is the 7-day forecast for Nantou?
06-10
28.0° 24.0°
3.19 mm
06-11
33.9° 24.3°
9.13 mm
06-12
29.2° 27.6°
4.88 mm
06-13
30.1° 26.3°
19.31 mm
06-14
30.3° 26.9°
4.25 mm
06-15
36.1° 28.5°
5.44 mm
06-16
33.9° 26.3°
21.0 mm
Both models agree
Avg diff: 1.9°C
Where are air quality stations near Nantou?
46
Ronggui street committee, Foshan (佛山容桂街道办)
43
Ronggui street committee, Foshan (佛山容桂街道办)
57
中山小榄, (中山市中山小榄)
38
中山小榄, (中山市中山小榄)
73
Shùndé sūgǎng, Foshan (佛山顺德苏岗)
33
Shùndé sūgǎng, Foshan (佛山顺德苏岗)
74
Shùndé sūgǎng, Foshan (佛山顺德苏岗)
50
Jinjuzui, Foshan (佛山金桔咀)
41
Jinjuzui, Foshan (佛山金桔咀)
68
Jinjuzui, Foshan (佛山金桔咀)
What cities are near Nantou?
Get AQI alerts for Nantou
Notify me when air quality reaches:
Free · No account · Unsubscribe any time
Data sources: AQI from ground-level monitoring stations via AQICN. Weather forecast from ECMWF (IFS & CAMS models). AQI calculated using US EPA standard. Updated 2026-06-10T10:05 UTC.