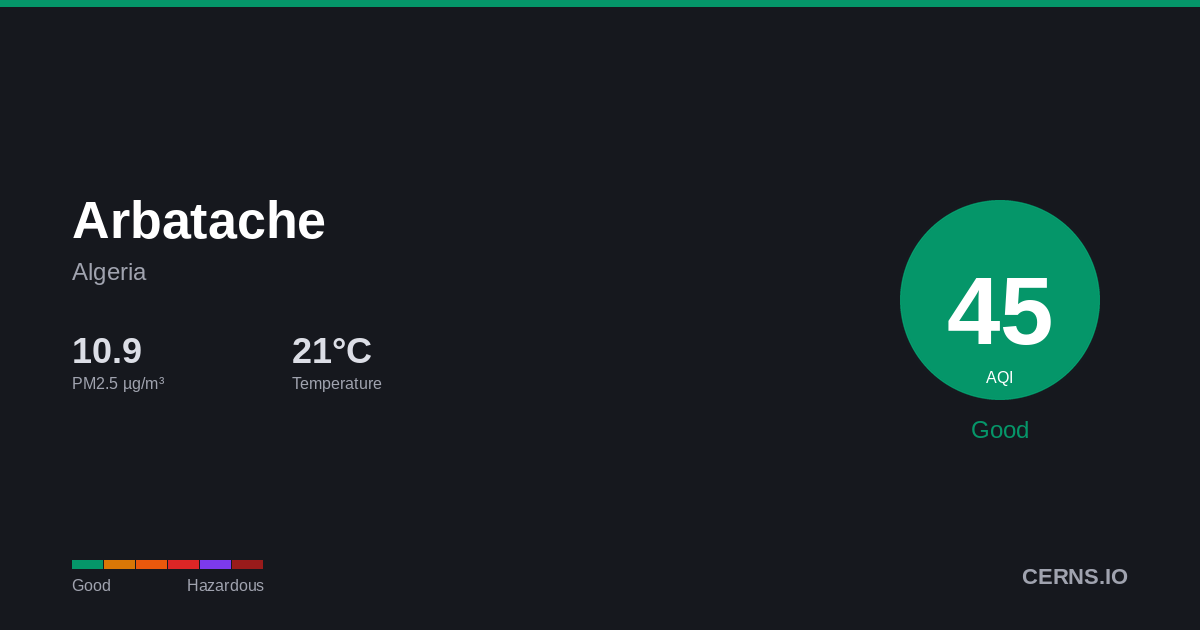
Air Quality History for Arbatache, Algeria
Historical PM2.5 and AQI trend from monitoring stations near Arbatache, Algeria.
How has the air in Arbatache been over the last 10 days?
The average AQI was 18 (Good), measured by monitoring stations near Arbatache. The worst day was 2026-11-16 (AQI 30, good); the cleanest was 2026-11-19 (AQI 4, good). Right now the AQI is 35 (Good) — see live air quality and health advice for Arbatache.
Ask ChatGPT about this trend35
Current AQI
Good Model estimate
Good Model estimate
Air Quality Index Station
105hPM2.5 Station
105h · 1 stationTemperature Weather model
56ptPrecipitation Weather model
mm/dayDaily Summary Station
| Date | AQI | Range | PM2.5 avg | PM10 avg | Hours | Stations |
|---|---|---|---|---|---|---|
| 2026-11-22 | 28 | 5–70 | 7.6 µg/m³ | 8.5 | 12h | 1 |
| 2026-11-21 | 28 | 5–71 | 6.8 µg/m³ | 7.8 | 22h | 1 |
| 2026-11-20 | 25 | 2–45 | 5.9 µg/m³ | 6.6 | 8h | 1 |
| 2026-11-19 | 4 | 1–8 | 1.0 µg/m³ | 2.1 | 11h | 1 |
| 2026-11-18 | 5 | 5–6 | 0.9 µg/m³ | 2.1 | 4h | 1 |
| 2026-11-17 | 11 | 1–23 | 2.7 µg/m³ | 3.3 | 11h | 1 |
| 2026-11-16 | 30 | 2–80 | 8.7 µg/m³ | 10.1 | 16h | 1 |
| 2026-11-15 | 23 | 5–68 | 6.1 µg/m³ | 6.8 | 6h | 1 |
| 2026-11-14 | 8 | 1–23 | 1.9 µg/m³ | 2.9 | 12h | 1 |
| 2026-11-13 | 14 | 3–31 | 3.4 µg/m³ | 4.2 | 3h | 1 |
Arbatache's air quality history — share it
CERNS.IO is free, with no paywall and no sign-up. As a small independent site, we depend on people sharing it — without that, we can’t keep it running. If this page helped you, sharing it is the best way to support us. Thank you! ♥
Have a blog or website? A link to cerns.io helps us even more.